-
제품

- 웹콘텐츠관리
- API 서버
- 웹프레임워크
- UI컴포넌트
- 텍사노미
-
자료

- 트라이얼
- 제품문서
- 동영상
-
가격/구매

- UI컴포넌트
- 구매문의
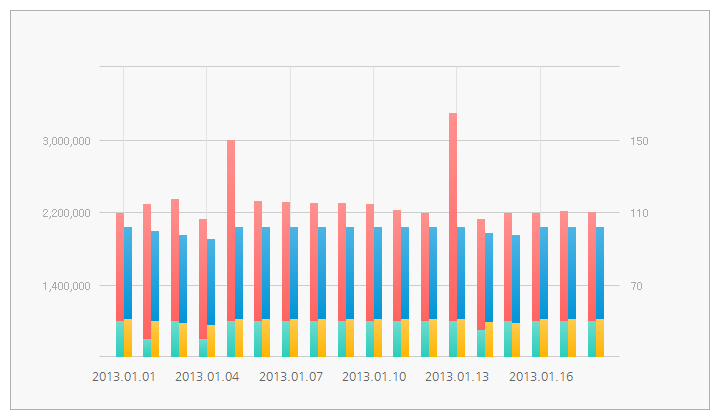
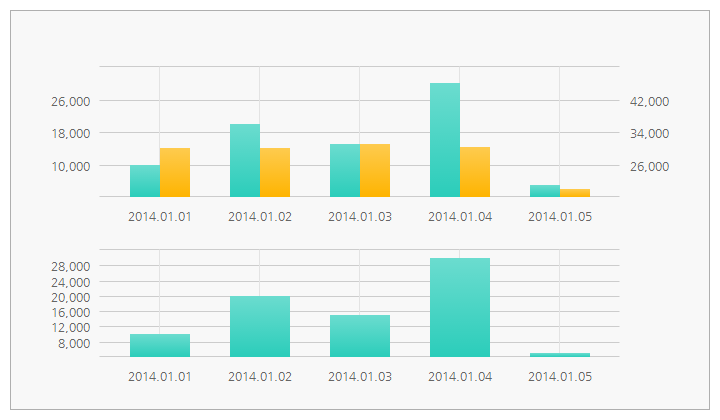
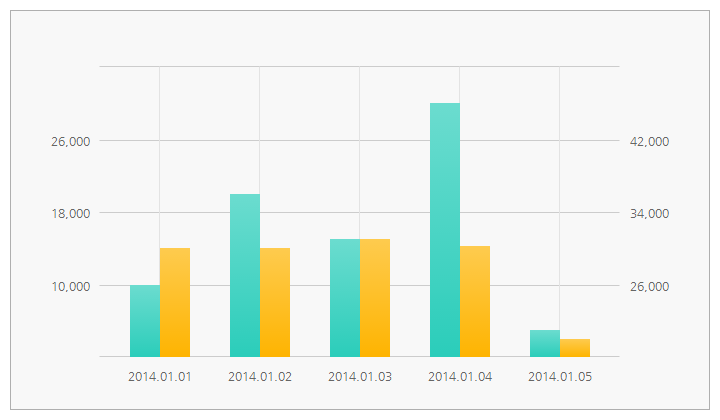
여러개의 시리즈 중 기준 Y축을 분리 할 수 있습니다.
var options = {
	data: {
		data: [
			{ Date: '20140101', Mprc: 10000, Cprc: 30000 },
			{ Date: '20140102', Mprc: 20000, Cprc: 30000 },
			{ Date: '20140103', Mprc: 15000, Cprc: 31000 },
			{ Date: '20140104', Mprc: 30000, Cprc: 30300 },
			{ Date: '20140105', Mprc: 5000, Cprc: 20000 }
		]
	},
	format: {
		xAxis: function(_str){
			return _str.substr(0, 4)+'.'+_str.substr(4,2)+'.'+_str.substr(6,2);
		},
		yAxis: 'priceDataFormat'
	},
	func: {
		tip: function(tipElement, data, rect){
			var date = data.xaxis.substr(0, 4)+'.'+data.xaxis.substr(4, 2)+'.'+data.xaxis.substr(6, 2);
			var tip = '<div class="text">'+date + ' / ' + String(data.yaxis).format().trim()+'</div>';
			tipElement.html(tip).show();
			var arrow = '<div class="arrow" style="width: '+tipElement.width() + 'px;"></div>';
			tipElement.html(tipElement.html() + arrow).css({
				left: rect.x - (tipElement.width() / 2), top: rect.y - 35
			});
		}
	},
	use: {
		animate: true,
		aCrossLine: true,
		multiYAxis: true
	}
};
var styles = {
	main: {
		layout: {
			paddingTop: 57, color: '#f8f8f8',
			line: {color: '#eaeaea', width: 1}
		},
		graph: {
			color: '#f8f8f8',
			line: {
				top: {color: '#cccccc'},
				left: {width: 0},
				right: {width: 0},
				bottom: {color: '#cccccc'}
			}
		},
		crossLine: {
			color: '#465866'
		},
		xAxis: {
			paddingTop: 13, height: 30,
			text: {family: 'Nanum Gothic', size: 12, color: '#666'},
			line: {color: '#e3e3e3', width: 1}
		},
		yAxis: {
			line: {color: '#cccccc', width: 1, opacity: 1}
		},
		tip: {
			className: 'tip'
		},
		series: {
			s1: {
				yAxis: {
					position: 'left',
					text: {family: 'Nanum Gothic', size: 12, color: '#666', align: 'right'}
				},
				area: {
					normal: {
						color: [ [0, '#2bcdba'], [100, '#6bdccf'] ],
						over: { color: [ [0, '#028c8e'], [100, '#33a2a4'] ] }
					}
				},
				line: {
					normal: {
						width: 0,
						over: { width: 0 }
					}
				},
				gradient: {
					direction: 'vertical'
				}
			},
			s2: {
				yAxis: {
					position: 'right',
					text: {family: 'Nanum Gothic', size: 12, color: '#666', align: 'left'}
				},
				area: {
					normal: {
						color: [ [0, '#feb401'], [100, '#fecb4e'] ],
						over: { color: [ [0, '#f28402'], [100, '#f59c33'] ] }
					}
				},
				line: {
					normal: {
						width: 0,
						over: { width: 0 }
					}
				},
				gradient: {
					direction: 'vertical'
				}
			}
		}
	}
};
var series = {
	"main": {
		"s1": {series: 'column', xaxis: 'Date', yaxis: 'Mprc'},
		"s2": {series: 'column', xaxis: 'Date', yaxis: 'Cprc'}
	}
};
var chart = webponent.chart.init($('.chart01'), options, styles, series);옵션 설정 중 use.multiYAxis = true;로 변경해주어야 한다.
멀티 Y축의 기준이 되는 SERIES 들이 있는데 그 Style SERIES 안에 yAxis: {...} 를 설정한다.
| default | type | 설명 | |||
|---|---|---|---|---|---|
| yAxis | width | 60 | number | 기준 Y축의 넓이 | |
| position | 'left' | string | 좌, 우 Y축중에 기준 Y축의 위치 ['left', 'right'] | ||
| paddingLeft | 10 | number | Y축 Label의 왼쪽 여백 | ||
| paddingRight | 10 | number | Y축 Label의 오른쪽 여백 | ||
| baseAtZero | false | boolean | false 인 경우 Y축은 최소값을 기준으로 표현되며, true 인 경우 Y축은 0을 기준으로 한다. | ||
| maxNumber | null | number | Y축의 최대값을 지정하고 싶을때 숫자값을 입력한다. | ||
| minNumber | null | number | Y축의 최소값을 지정하고 싶을때 숫자값을 입력한다. | ||
| fit | false | boolean | Y축의 Interval을 소수점 단위까지 보여주고 싶을때 사용한다. false 이면 1단위(Default)로 interval 된다. options의 format.yAxis와는 다른 것으로 주로 Y축의 최대값과 최소값의 차이가 0보다 크고 5 미만일때 Y축 inverval의 간격을 여과없이 보여주고자 사용한다. | ||
| useValue | min | false | boolean | 제일 처음 값 출력 여부 | |
| max | false | boolean | 제일 마지막 값 출력 여부 | ||
| text | family | 'dotum' | string | 글꼴 종류 이름(영문명) | |
| size | 12 | number | 글꼴 크기(px 단위) | ||
| color | '#aaa' | string | 글꼴 색상(영문 색상명 혹은 RGB값) | ||
| align | 'left' | 'string' | label width 내에서의 텍스트 위치['left', 'right', 'center'] | ||
| style | 'normal' | 'string' | 글꼴 모양['normal', 'bold', 'italic'] | ||
| opacity | 1 | number | 글꼴 투명도 (0~1) | ||
| format | null | function | Y축 텍스트 Formatting
|
멀티 Y축의 기준이 되는 SERIES 들이 있는데 그 SERIES에 yaxisid = '기준이 되는 Series KEY 명' 을 입력한다.
var options = {
	use: {
		multiYAxis: true
	}
};
var styles = {
	main: {
		series: {
			s1: {
				yAxis: {
					position: 'left'
				}
			},
			s2: {
				yAxis: {
					position: 'right'
				}
			},
			s3: {

			}
		}
	}
};
var series = {
	main: {
		s1: { series: 'line', xaxis: 'x축 데이터 key', yaxis: 'y축 데이터 key', yaxisid: 's1' }, // 기준이 되는 series 하나만 사용 될 경우 yaxisid는 적지 않아도 된다.
		s2: { series: 'line', xaxis: 'x축 데이터 key', yaxis: 'y축 데이터 key', yaxisid: 's2' },
		s3: { series: 'line', xaxis: 'x축 데이터 key', yaxis: 'y축 데이터 key', yaxisid: 's2' }  // 기준이 되는 series의 key 명을 입력한다.
	}
};