Column Series
3
Overview
Overview
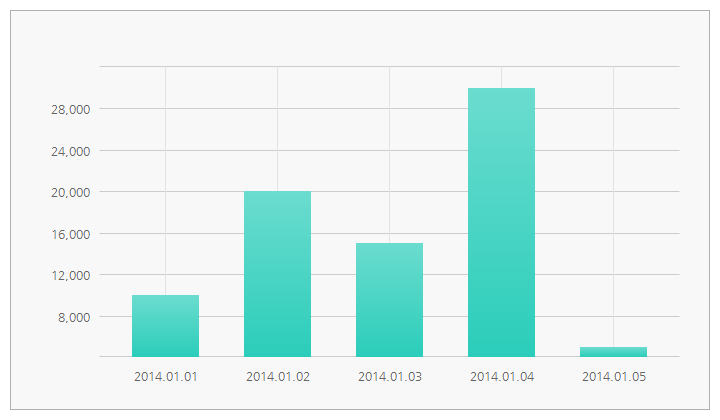
Chart Series 중 Column Series (세로 막대 시리즈)의 샘플 및 설정.
<!DOCTYPE html>
<html>
<head>
	<meta http-equiv="Content-Type" content="text/html; charset=UTF-8"/>
	<title>CHART01</title>
	<script type="text/javascript" src="../../../lib/comm/jquery-1.9.1.min.js"></script>
	<script type="text/javascript" src="../../../lib/comm/raphael.js"></script>
	<script type="text/javascript" src="../../../lib/comm/webponent.comm.common.js"></script>
	<script type="text/javascript" src="../../../lib/chart/webponent.chart.js"></script>
	<style type="text/css">
		.chart01 {width: 100%; height: 400px; border: 1px solid #eee;}
	</style>
	<script type="text/javascript">
	window.onload = function(){
		var options = {
			data: {
				data: [
					{ Date: '20140101', Mprc: 10000 },
					{ Date: '20140102', Mprc: 20000 },
					{ Date: '20140103', Mprc: 15000 },
					{ Date: '20140104', Mprc: 30000 },
					{ Date: '20140105', Mprc: 5000 }
				]
			},
			format: {
				xAxis: function(_str){
					return _str.substr(0, 4)+'/'+_str.substr(4,2)+'/'+_str.substr(6,2);
				}
			},
			use: {
				animate: true,
				aCrossLine: true
			}
		}
		var styles = {
			main: {
				graph: {
					color: '#fafafa'
				},
				yAxis: {
					text: {
						align: 'right'
					}
				},
				series: {
					s1: {
						area: {
							normal: {
								color: 'skyblue', opacity: 0.5,
								over: {
									color: 'skyblue', opacity: 1
								}
							}
						},
						line: {
							normal: {
								color: 'blue',
								over: {
									color: 'blue'
								}
							}
						}
					}
				}
			}
		};
		var series = {
			"main": {
				"s1": {series: 'column', xaxis: 'Date', yaxis: 'Mprc'}
			}
		};
		var chart = webponent.chart.init($('.chart01'), options, styles, series);
	};
	</script>
</head>
<body>
	<div class="chart01"></div>
</body>
</html>
Demo
Configuration Styles
var defaultStyles = {
	itemWidth: 60,
	area: { // 면 색상
		// 일반적인 색상
		normal: { color: '#abe55c', opacity: 1, over: {color: '#77bf10', opacity: 1}},
		// 상승, 하락, 보합 표현을 하고자 할 경우
		up: 	{ color: '#c42c1c', opacity: 1, over: {color: '#c42c1c', opacity: 1}}, // 상승
		down: 	{ color: '#2e80cc', opacity: 1, over: {color: '#2e80cc', opacity: 1}}, // 하락
		flat: 	{ color: '#eeeeee', opacity: 1, over: {color: '#eeeeee', opacity: 1}}, // 보합
		// 막대마다 다른 색상을 추가 하고자 할 경우 사용
		items: null
	},
    line: { // 선 색상
		// 일반적인 색상
		normal: { color: '#77bf10', width: 1, opacity: 1, over: { color: '#77bf10', width: 1, opacity: 1 } },
		// 상승, 하락, 보합 표현을 하고자 할 경우
		up:     { color: '#c42c1c', width: 1, opacity: 1, over: { color: '#c42c1c', width: 1, opacity: 1 } }, // 상승
		down:   { color: '#2e80cc', width: 1, opacity: 1, over: { color: '#2e80cc', width: 1, opacity: 1 } }, // 하락
		flat:   { color: '#eeeeee', width: 1, opacity: 1, over: { color: '#eeeeee', width: 1, opacity: 1 } }, // 보합
		base:   { color: '#000000', width: 1, opacity: 1, over: { color: '#000000', width: 1, opacity: 1 } }, // 0 기준선
		// 막대마다 다른 색상을 추가 하고자 할 경우 사용
		items: null
	},
	gradient: { // 그라데이션 진행방향
		direction: 'horizontal' // ["horizontal", "vertical"]
	},
	text: { // 막대별 텍스트 출력 유무 및 스타일 정의
		use: false,			// 사용 유무	[ false : true ]
		family: 'dotum', 	// 글꼴 종류
		size: 11, 			// 글꼴 크기
		color: '#000000', 	// 글꼴 색상
		align: 'center',	// 글자 정렬	[ 'center' : 'left' : 'right' ]
       	style: 'normal', 	// 글꼴 모양	[ 'normal' : 'bold' : 'italic' ]
		opacity: 1, 		// 글자 투명도	[ 1 ~ 0 ]
		format: null, 		// 글자 출력 양식
		func: null			// 글자의 위치나 전반적인 모양새를 변경하고자 할 경우
	},
	accessibility: {		// up / down 표현시에 접근성
		use: false,			// 사용 유무
		style: 'normal'		// 접근성 Bullet Style [ 'normal' : 'triangle' ]
	},
	itemRenderer: {			// 막대 아이템 하나의 모양
		style: 'normal', 	// 기본 제공 모양 [ 'normal' : 'ox' ]
		setRenderer: null	// 외부에서 아이템 모양을 직접 변경하고자 할 경우 사용
	}
};
색상(면, 선) 변경
Normal Setting
일반적인 막대 시리즈
Usage
var styles = {
	series: {
		s1: {
			area: { 					// 면 Style
				normal: {					// 일반 Style
					color: [ [0, '#2bcdba'], [100, '#6bdccf'] ],  	// English color name, RGB 값, 그라데이션 배열, 패턴 이미지
					over: {  										// MouseOver시 활성화 되는 면 스타일
						color: { 										// 패턴이미지를 사용하고자 할 경우의 설정법
							src: '../webponent/chart/sample_svg/chart/img/over.png', 	// 이미지 URL
							color: '#4e6679' 											// 아이템의 넓이가 5픽셀 이하인 경우에는 패턴대신 color 설정값으로 대체
						}
					}
				}
			},
			line: {						// 선 Style
				normal: {					// 일반 Style
					width: 0,					// 선의 두께 0 ~
					over: { 					// Mouseover시 활성화 되는 선 스타일
						width: 0
					}
				}
			}
		}
	}
}
Demo
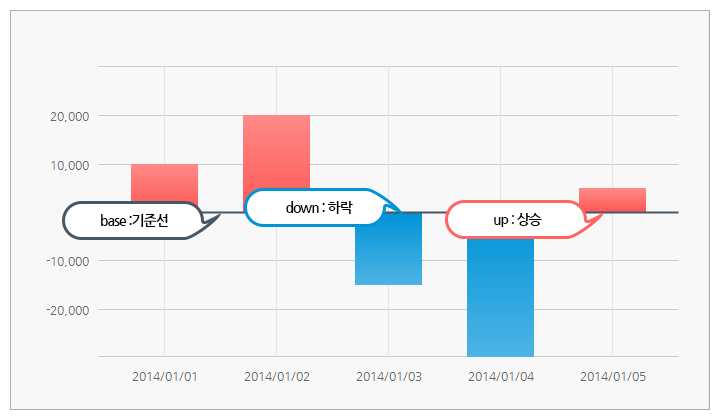
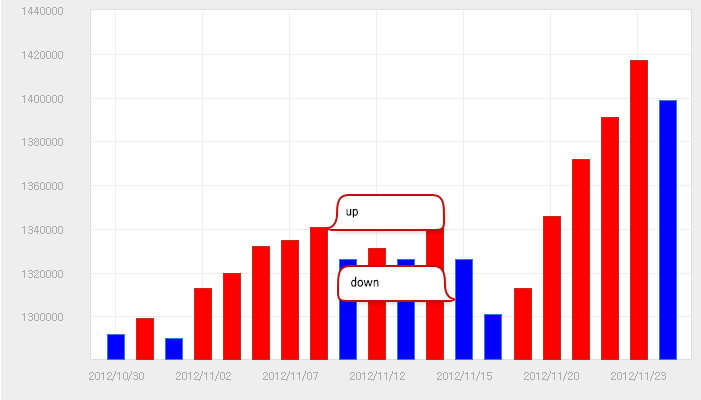
UpDown Setting
상승, 하락 표현 막대 시리즈
Usage
var styles = {
	series: {
		s1: {
			area: { 											// 면 Style
				up: {												// 상승 Style
					color: [ [0, '#fe5855'], [100, '#fe8a88'] ], 		// English color name, RGB 값, 그라데이션 배열, 패턴 이미지
					over: {												// MouseOver시 활성화 되는 면 스타일
						color: [ [0, '#ca2c29'], [100, '#d55552'] ]			// English color name, RGB 값, 그라데이션 배열, 패턴 이미지
					}
				},
				down: {												// 하락 Style - 상승 Style과 동일한 설정
					color: [ [0, '#4db4e4'], [100, '#0093d8'] ],
					over: {
						color: [ [0, '#337fb9'], [100, '#0260a9'] ]
					}
				},
				flat: {												// 보합( 상승 하락 둘다 아닐 경우) Style - 상승 Style과 동일한 설정
					color: [ [0, '#6a8091'], [100, '#8899a7'] ],
					over: {
						color: [ [0, '#4f677a'], [100, '#718594'] ]
					}
				}
			},
			line: {												// 선 Style
				up: {												// 상승 Style
					width: 0,											// 선의 두께 0 ~
					over: {												// MouseOver시 활성화 되는 선 스타일
						width: 0
					}
				},
				down: {												// 하락 Style
					width: 0,
					over: {
						width: 0
					}
				},
				flat: {												// 보합 Style
					width: 0,
					over: {
						width: 0
					}
				},
				base: {												// 0 기준선 Style - 기준선은 MouseOver 이벤트가 없으므로 따로 활성화 스타일을 설정하지 않음.
					color: '#465866',
					width: 2
				}
			}
		}
	}
}
Demo
Gradient Setting
그라데이션 형식
[ [ 0 ~ 100, 'English color name or RGB value' ], [ 0 ~ 100, 'English color name or RGB value' ] ]
배열 형식으로 정의 되며 0번 index의 0~100 사이의 값보다 1번 index의 0~100 사이의 값이 더 커야 한다.
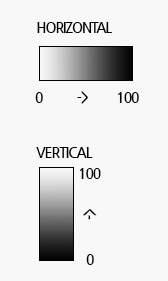
- 그라데이션 위치 및 값 지정방법 위의 이미지를 참조
- Vertical의 경우 100 ~ 0으로 반대로 입혀지지만 설정값 입력시에는 0 ~ 100 의 순서로 입력해주어야 한다.
horizontal : [[0, 'white'], [100, 'black']]
vertical : [[0, 'black'], [100, 'white']]
Usage
var styles = {
	series: {
		s1: {
			area: {
				normal: {
					color: [ [0, '#51ccff'], [50, '#005072'], [100, '#51ccff'] ], // Array[ [], [], [] ]
					over: {
						color: '#005072'
					}
				},
			},
			line: {
				normal: {
					width: 0,
					over: {
						width: 0
					}
				}
			},
			gradient: {					// 그라데이션
				direction: 'vertical'		// 그라데이션 시작 방향 [ 'horizontal', 'vertical' ]
			}
		}
	}
}
Demo
PatternImage Setting
패턴이미지로 면 채우기
{ src: 이미지 경로, color: 'value' }
데이터의 양이 많아 막대의 넓이가 일정 사이즈 이하 일 경우에는 패턴의 의미가 상실되므로 src 대신 color 값을 적용 한다.
jpg, png, gif 가능. bmp도 가능하나 이미지 용량이 성능에 영향을 주므로 여러 확장자 중 적은 용량 이미지를 사용하길 추천한다.
Usage
var styles = {
	series: {
		s1: {
			area: {
				normal: {
					color: [ [0, '#2bcdba'], [100, '#6bdccf'] ],
					over: {
						color: {  // src : 이미지 경로, color : 이미지 대신 채워질 색상 값
							src: '../webponent/chart/sample_svg/chart/img/over.png',
							color: '#4e6679'
						}
					}
				}
			},
			line: { normal: { width: 0,	over: { width: 0 } } }
		}
	}
}
Demo
Coloring each of the item
각 아이템(막대) 별로 색상 지정
- 데이터의 갯수 만큼 색상 관련 설정을 지정하여 items 배열로 저장
- 단색, 패턴, 그라데이션 모두 다 가능
- 데이터의 갯수보다 설정 스타일이 부족할 경우 오류.
- 데이터의 갯수보다 설정 스타일이 많은 경우 상관없음.
- 선의 경우 items가 null 이면 normal 스타일이 적용된다.
Usage
var styles = {
	series: {
		s1: {
			area: {
				items: [
					items: [ // 아이템 갯수별 색상 지정
						{
							color: [ [0, '#2bcdba'], [100, '#6bdccf'] ],
							over: { color: [[0, '#018b8d'], [100, '#33a2a4']]  }
						},
						{
							color: [ [0, '#ff625f'], [100, '#ff918f'] ],
							over: { color: [[0, '#ca2b28'], [100, '#d55552']]  }
						},
						{
							color: [ [0, '#feb402'], [100, '#fecb4e'] ],
							over: { color: [[0, '#f28301'], [100, '#f59c33']]  }
						},
						{
							color: [ [0, '#0193d8'], [100, '#4db4e4'] ],
							over: { color: [[0, '#0260a9'], [100, '#337fb9']]  }
						},
						{
							color: [ [0, '#8671e1'], [100, '#ab9bea'] ],
							over: { color: [[0, '#5744a3'], [100, '#7869b5']]  }
						}
					]
				]
			},
			line: {
				items: [
					{ width: 0,	over: { width: 0 } },
					{ width: 0,	over: { width: 0 } },
					{ width: 0,	over: { width: 0 } },
					{ width: 0,	over: { width: 0 } },
					{ width: 0,	over: { width: 0 } }
				]
			}
		}
	}
}
Demo
form
form : 'updown'
0을 기준으로 상, 하, 기준 표현
form : 'updown_base'
첫번째 아이템을 기준으로 큰 아이템은 상, 작은 아이템은 하, 같은 아이템은 보합
기준가격을 설정하는 방법
- options.data.prevClose = null 에 기준가격 제시(순수 number 값만 기입) (자세히 보기)
- options.data.prevClose 에 제시되어 있지 않으면 첫번째 아이템 기준으로 상, 하가 정해짐
form : 'updown_before'
기준가격을 시작으로 다음 아이템이 크면 상, 작으면 하
기준가격을 설정하는 방법
- options.data.prevClose = null 에 기준가격 제시(순수 number 값만 기입) (자세히 보기)
- options.data.prevClose 에 제시되어 있지 않으면 첫번째 아이템 기준으로 상, 하가 정해짐
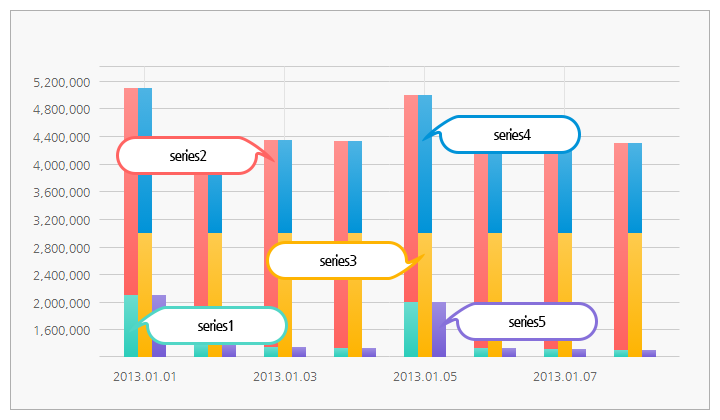
form : 'stack'
여러개의 Series를 쌓는 form
- 어떤 Series 위로 붙을 것인지 yaxisid에 기준이 되는 Series의 key값을 적어준다.
- yaxisid가 정의되어 있지 않다면 제일 첫번째 series가 기준이 된다.
- Series가 보여지는 순서대로 정의
Usage
var styles = {
	series: {
		s1: {
			area: { normal: { color: { src: 'pattern01.gif', color: '#6453aa' } } },
			line: { normal: { width: 0 } }
		},
		s2: {
			area: { normal: { color: { src: 'pattern02.gif', color: '#f0b72f' } } },
			line: { normal: { width: 0 } }
		},
		s3: {
			area: { normal: { color: { src: 'pattern03.gif', color: '#c83844' } } },
			line: { normal: { width: 0 } }
		},
		s4: {
			area: { normal: { color: { src: 'pattern04.gif', color: '#f0b72f' } } },
			line: { normal: { width: 0 } }
		},
		s5: {
			area: { normal: { color: { src: 'pattern05.gif', color: '#e76530' } } },
			line: { normal: { width: 0 } }
		}
	}
}
var series = {
	main: {
		s1: { series: 'column', form: 'stack', xaxis: 'date', yaxis: 'price1' },
		s2: { series: 'column', form: 'stack', xaxis: 'date', yaxis: 'price2' },
		s3: { series: 'column', form: 'stack', xaxis: 'date', yaxis: 'price3', yaxisid: 's3' },
		s4: { series: 'column', form: 'stack', xaxis: 'date', yaxis: 'price4', yaxisid: 's3' },
		s5: { series: 'column', form: 'stack', xaxis: 'date', yaxis: 'price5', yaxisid: 's5' }
	}
}
Demo
form : 'updown_stack'
상, 하로 나뉘지만 같은 위치에서 갈라지는 형태
- 어떤 Series 위로 붙을 것인지 yaxisid에 기준이 되는 Series의 key값을 적어준다.
- yaxisid가 정의되어 있지 않다면 제일 첫번째 series가 기준이 된다.
- Series가 보여지는 순서대로 정의
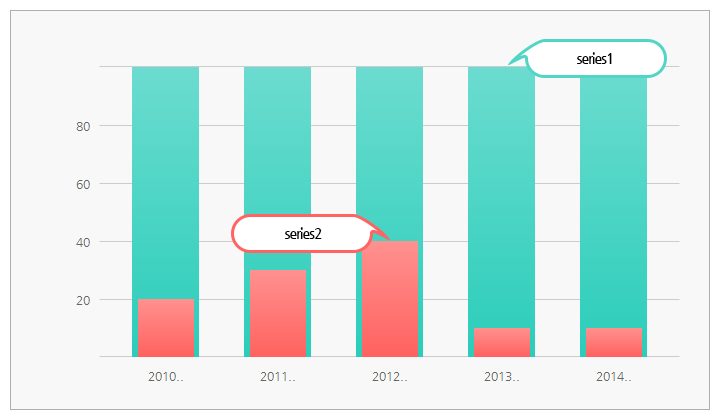
form : 'bullet'
stack은 자신의 앞 Series에 더해진 값이 그려진 것이라면 bullet은 앞 Series에 상관없이 최저값을 기준으로 그려진다.
Y축의 값은 최대 100 이 자동으로 설정된다.
Usage
var styles = {
	series: {
		s1: {
			area: {
				normal: {
					color: [ [0, '#2bcdba'], [100, '#6bdccf'] ],
					over: { color: {src: '../webponent/chart/sample_svg/chart/img/over.png', color: '#4e6679'} }
				}
			},
			line: { normal: { width: 0, over: { width: 0 } } },
			gradient: {
				direction: 'vertical'
			}
		},
		s2: {
			itemWidth: 50, // 막대의 넓이 (1~100 %)
			area: {
				normal: {
					color: [ [0, '#ff625f'], [100, '#ff918f'] ],
					over: { color: {src: '../webponent/chart/sample_svg/chart/img/over.png', color: '#4e6679'} }
				}
			},
			line: { normal: { width: 0, over: { width: 0 } } },
			gradient: {
					direction: 'vertical'
			}
		}
	}
}
var series = {
	main: {
		s1: { series: 'column', form: 'bullet', xaxis: 'date', yaxis: 'price1' },
		s2: { series: 'column', form: 'bullet', xaxis: 'date', yaxis: 'price2' }
	}
}
Demo
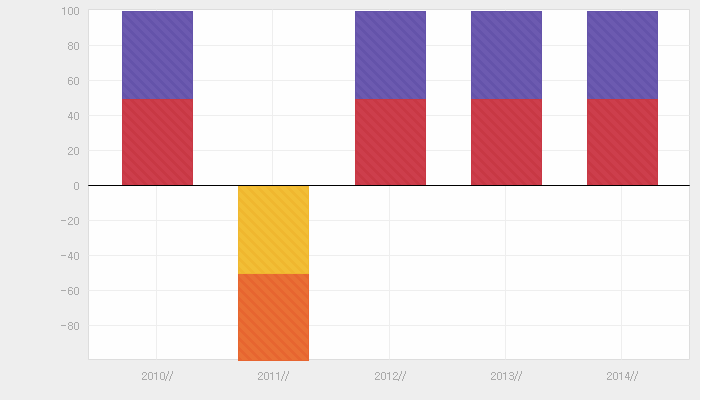
form : 'updown_bullet'
bullet 형식 + 상, 하 분리
Y축의 값은 최소 -100 ~ 최대 100 이 자동으로 설정된다.
form : 'overlap'
bullet 과 같은 모양이지만 Y축의 제한을 없앤 형식

Usage
var styles = {
	series: {
		s1: {
			area: {
				normal: {
					color: [ [0, '#2bcdba'], [100, '#6bdccf'] ],
					over: { color: {src: '../webponent/chart/sample_svg/chart/img/over.png', color: '#4e6679'} }
				}
			},
			line: { normal: { width: 0, over: { width: 0 } } },
			gradient: {
				direction: 'vertical'
			}
		},
		s2: {
			itemWidth: 50, // 막대의 넓이 (1~100 %)
			area: {
				normal: {
					color: [ [0, '#ff625f'], [100, '#ff918f'] ],
					over: { color: {src: '../webponent/chart/sample_svg/chart/img/over.png', color: '#4e6679'} }
				}
			},
			line: { normal: { width: 0, over: { width: 0 } } },
			gradient: {
					direction: 'vertical'
			}
		}
	}
}
var series = {
	main: {
		s1: { series: 'column', form: 'overlap', xaxis: 'date', yaxis: 'price1' },
		s2: { series: 'column', form: 'overlap', xaxis: 'date', yaxis: 'price2' }
	}
}
Demo
form : 'updown_overlap'
overlap 형식 + 상, 하 분리
updown_bullet 에서 Y축의 제한을 없앤 형태

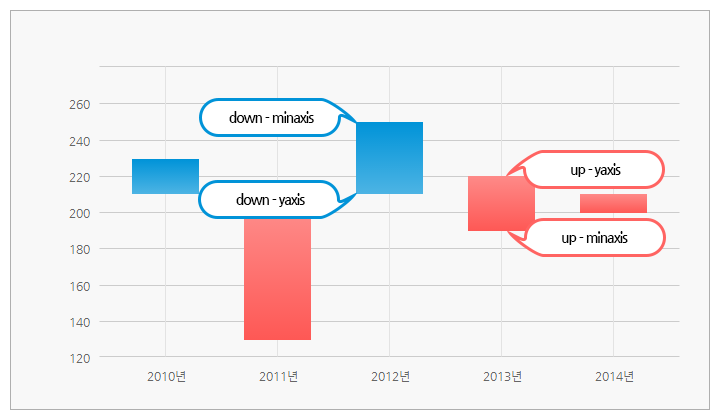
minaxis (최소값)
yaxis 말고 최소값이 있을 경우 series 설정시 minaxis: 'data key name' 을 입력
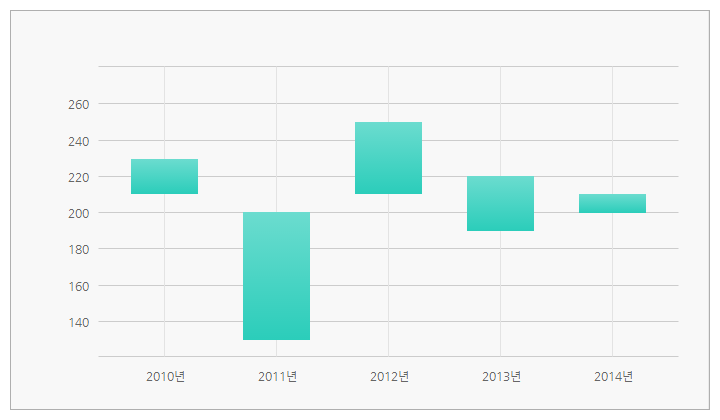
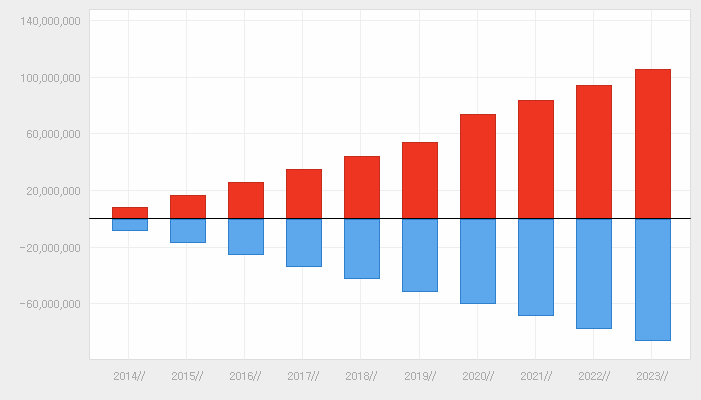
form : 'updown_minaxis'
minaxis값이 yaxis 값 보다 더 클 경우에 색상으로 상, 하 표현하고자 할 경우 사용
Usage
var options = {
	data: {
		data: [
			{"xdata": "2010", "cost1": "210", "cost2": "230"},
			{"xdata": "2011", "cost1": "200", "cost2": "130"},
			{"xdata": "2012", "cost1": "210", "cost2": "250"},
			{"xdata": "2013", "cost1": "220", "cost2": "190"},
			{"xdata": "2014", "cost1": "210", "cost2": "200"}
		]
	}
}
var styles = {
	series: {
		s1: {
			area: {
				up: {
					color: [ [0, '#fe5855'], [100, '#fe8a88'] ],
					over: { color: [ [0, '#ca2c29'], [100, '#d55552'] ] }
				},
				down: {
					color: [ [0, '#4db4e4'], [100, '#0093d8'] ],
					over: { color: [ [0, '#337fb9'], [100, '#0260a9'] ] }
				},
				flat: {
					color: [ [0, '#6a8091'], [100, '#8899a7'] ],
					over: { color: [ [0, '#4f677a'], [100, '#718594'] ] }
				}
			},
			line: {
				up: { width: 0, over: { width: 0 } },
				down: { width: 0, over: { width: 0 } }
			},
			gradient: { direction: 'vertical' }
		}
	}
}
var series = {
	main: {
		s1: { series: 'column', form: 'updown_minaxis', xaxis: 'xdata', yaxis: 'cost1', minaxis: 'cost2' }
	}
}
var chart = webponent.chart.init($('.chart02'), options, styles, series);
Demo
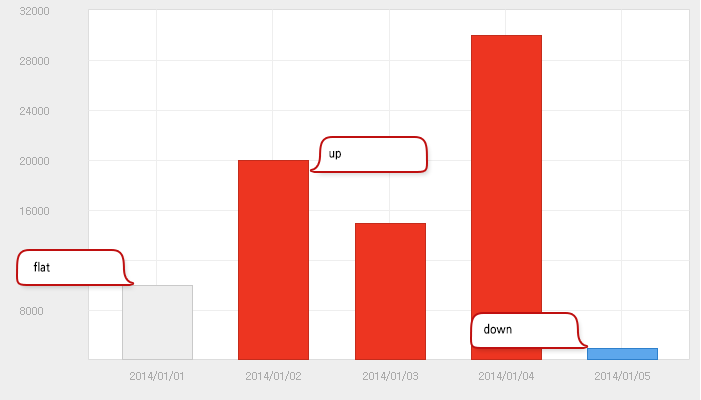
Labeling Columns
text.use = false;
아이템별 정보(annotation) 출력 여부
Parameters
| value | boolean | [ false, true ] |
text.family = 'dotum';
글꼴 종류
Parameters
| value | string | 글꼴 종류. 영문이름으로 입력 |
text.size = 11;
글꼴 크기
Parameters
| value | number | 글꼴 크기 |
text.color = '#000000';
글꼴 색상
Parameters
| value | string | 영문 컬러명이나 RGB 값 |
text.align = 'center';
글자 정렬
Parameters
| value | string | [ 'center', 'left', 'right' ] |
text.style = 'normal';
글자 스타일
Parameters
| value | string | [ 'normal', 'bold', 'italic' ] |
text.valign = 'top';
글자의 세로 정렬. text.func가 null 일 경우에만 적용된다.
Parameters
| value | string | [ 'top', 'middle', 'bottom' ] |
text.opacity = 1;
글자 투명도
Parameters
| value | number | 0 ~ 1 |
text.format = null;
글자 출력 형식 정의 (정의되어 있는 형식 안내)
- 텍스트의 위치는 그대로이면서 텍스트의 출력 형식만 바꾸고자 할 경우 사용(text.func와 동시 적용이 안됨)
- 두개 동시에 설정되었을 경우에는 func이 적용된다.
Parameters
| formatter | function | 아이템 위에 출력될 데이터 형식 정의
|
Returns
| value | string | 출력 형식이 적용된 텍스트 |
text.func = null;
글자 출력 위치(x, y) 와 글꼴 출력형식 정의
- 글자의 형식 뿐만 아니라 위치도 변경하고 싶을 때 사용(text.format과 동시 적용이 안됨)
- 두개 동시에 설정되었을 경우에는 func이 적용된다.
Parameters
| formatter | function | 아이템 위에 출력될 데이터 형식 정의
|
Returns
| value | object | { x: 텍스트의 x좌표, y: 텍스트의 y좌표, text: 출력될 텍스트 } |
Usage
var styles = {
	series: {
		s1: {
			text: {
				use: true,
				family: 'Nanum Gothic',
				size: 12,
				valign: 'top',
				color: '#666666',
				// format만 쓰거나
				format: 'priceDataFormat'
				// func만 쓰거나
				func: null
			}
		}
	}
}
Demo
Accessibility
accessibility.use = false;
접근성 관련 사용유무
- form: updown 에서만 사용
Parameters
| value | boolean | [ false, true ] |
accessibility.style = 'normal';
접근성 모양 설정
- 색상 설정은 area와 line에 정의된 대로 똑같이 적용된다.
- 단, Line의 width나 opacity가 0이이면 normal 스타일의 +/- 의 라인색상이 없으므로 화면에 안보여주므로 디자인시에 주의
Parameters
| value | string | [ 'normal', 'triangle' ] normal : + / - triangle : ▲ / ▼ |
Usage
var styles = {
	series: {
		s1: {
			accessibility: {
				use: true,
				style: 'triangle'
			}
		}
	}
}
Demo
itemRenderer
itemRenderer.setRenderer = null;
막대모양이 아닌 다른 모양(skin)을 입히고 싶을 때
Parameters
| canvas | svg | svg. 그림을 그릴수 있는 영역 |
| shape | object | {left, top, width, height} |
| data | object | 그려질 아이템의 데이터 |
| styles | object | Series의 스타일 |
Returns
| element | svg element | svg의 element. |
Usage
var styles = {
	series: {
		s1: {
			itemRenderer: {
				setRenderer: function(canvas, shape, data, styles){
					// x, y, radius
					var item = canvas.circle(shape.left + shape.width/2, shape.top + shape.height/2,  shape.height / 2)
									 .attr({
											fill: '90-#2bcdba:0-#6bdccf:100-100', stroke: ''
									  });
					return item;
				}
			}
		}
	}
}